To sign up for our daily email newsletter, CLICK HERE
The financial markets fluctuate along range and trend stages to determine the prices of assets, and these prices tend to around key levels. Two indicators, the Alligator and Moving Averages, can help traders find ranges, measure trends and key levels. How? Let’s start by pointing out their characteristics to understand how they could work together.
Characteristics of Alligator And Moving Averages
The Williams Alligator is an indicator for measuring the trend strength of a financial instrument. Since it was designed under the assumption that markets only trend 15 to 30 percent of the time, it carries a distinct characteristic regarding the identification of ranges markets.
Said easily: The Alligator is as suitable for spotting trends as it is for identifying ranges. It means that this indicator will spot a trend only when the price gets effectively out of range. The market needs to exploit that theoretical 15-30 percent chance of being in a trend for the Alligator to work in its best terms.
Perhaps that is why Alligator deals with another characteristic: It is a lagging indicator. It means that its responsiveness to price changes is sluggish. The indicator works better in higher time frames with prolonged trends.
Learn more about the Alligator indicator at Altrady!
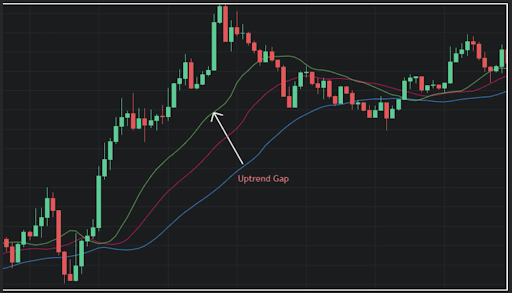
Finally, the most relevant characteristic is the gap: Alligator measures the trend strength as the gap within its lines expands (high strength) and narrows (low strength).
In resume:
- The Alligator spot trends and ranges.
- It is a lagging indicator.
- It measures the trend strength.
On the other side, Moving Averages smooth out the price changes. Their objective is to provide a directional sense of market fluctuations.
The more crucial characteristics of moving averages belong to their periods: the longer the period of an MA, the less responsive it is to fluctuations.
Generally, popular MA periods, such as 14, 20, and 26, follow the price closely, indicating dynamic support and resistance levels as the price moves upward or downward, especially during a notable trend.
Other periods, such as 50 and 100, follow the price from far away, but when they get close, they denote more meaningful support and resistance key levels.
In resume:
- MA smooths out price fluctuations.
- Shorter MA periods suggest more dynamic levels.
- Longer MA periods pinpoint key levels.
Check out also: Choosing Between Simple & Exponential Moving Averages: A Complete Guide!
Alligator with 50 or 100 MA: The perfect combination
By understanding the essence of the Alligator and moving averages, traders can craft a perfect combination that leverages the former ability to spot ranges and subsequent trends while measuring their strength and the latter capacity to spot key levels at longer periods while smoothing the price fluctuations.
By using 100 or 50 MA periods, traders can also reduce the noise to their eyes from seeing several lines plotted in the chart since the Alligator already plots three.
This combination only has to serve three purposes:
- Spotting ranges with the Alligator to know when the market is not trending and by how much time.
- Identifying key levels with 50 or 100 moving averages to spot significant pivotal prices in a trend.
- Measuring the trend strength with the Alligator’s gap. When it narrows while the MA gets close, suggesting an upcoming key level, both indicate the end of a trend and the likelihood of a reversal move.
Conclusión
Both the Alligator and Moving Averages are powerful tools to spot trends. In combination, both enhance each other by taking advantage of their different characteristics.
