To sign up for our daily email newsletter, CLICK HERE
original article Mengenal Indikator Ichimoku
Have you ever wondered, is there a trend indicator that is most reliable?
Is there one indicator that can include information on the state of the market for each opportunity?
What if there is? Well, at least this one indicator answer your wishes because many market experts appreciate its reliability.
Keep on reading this article, Finex will explain it to you until you understand how to use it. This is one of the popular methods widely used by traders.
What is the Ichimoku indicator?
Ichimoku Kinko Hyo (IKH) or commonly called Ichimoku is a technical indicator developed in the 1930s by a Japanese journalist named Goichi Hosoda. He spent 30 years perfecting his invention before making it widely available in the late 1960s.
Basically, Ichimoku is defined as a single glance equilibrium graph or it can also be called an instant display of graphs. Sometimes this indicator is known as a “one-glance cloud chart”, based on the Cloud feature built into Ichimoku.
Ichimoku belongs to a system based on moving averages and because it contains more data points than a typical candlestick chart, Ichimoku provides a clearer picture of potential price action.
The main difference between the moving averages used on Ichimoku compared to other methods is that Ichimoku lines are constructed using 50% highs and lows. In addition to price action, Ichimoku also considers the time aspect as an additional element.
The calculation contained in this indicator is quite complicated, but it is very useful for you to see the direction of the dominant trend and the point of reversal momentum. Apart from that, you can also use it to set support and resistance levels.
Understanding Ichimoku means learning a good foundation that can be applied to any strategy. Not only that, you can also use it as a single indicator that is adequate to perform technical analysis.
Ichimoku basic components
Through the following table, you can find out the basic components of the Ichimoku indicator.
| Nama Jepang |
Nama Inggris |
Gambar |
Deskripsi |
| Kumo |
Cloud |
|
Ruang di antara Senkou Span A dan Senkou Span B yang telah bergerak maju. |
| Kijun-sen |
Base line |
|
MA jangka panjang (biasanya 26 periode). |
| Tenkan-sen |
Turning line |
|
MA jangka pendek (biasanya 9 periode). |
| Chinkou Span |
Lagging line |
|
Harga penutupan candle saat ini, yang telah dimundurkan 26 periode ke belakang. |
Senkou Span A
How to calculate Senkou Span A is: (Tenkan-sen + kijun-sen)/2 which is plotted over the next 26 periods.
Senkou Span A is also known as leading span 1. This line forms one part of the kumo or cloud.
If the price is above the Senkou Span, then the top line serves as the first support level, while the bottom line serves as the second support level. If the price is below the Senkou Span, the bottom line forms the first resistance level, while the top line is the second resistance level.
Senkou Span B
How to calculate Senkou Span B: (highest point + lowest point)/2 is calculated over the last 52 time periods and plotted over the next 26 periods.
Example of a chart on the Ichimoku indikator
By looking at the example chart on the Ichimoku indicator below, we can distinguish past, present, and future price movements.
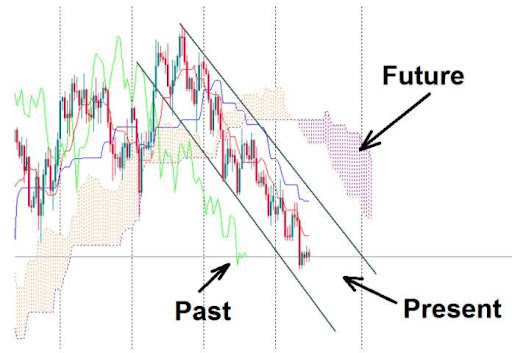
Image description:
Present time
There are two lines: Kijun and Tenkan-Sen.
Kijun Line (Base Line) is a moving average with a larger period. Rather than Kijun, prices cross more often with Tenkan-Sen (Conversion Line). If the price crosses with the Kijun, then there is a signal of a change in the market.
Future
Represented by the Ichimoku Cloud which is formed from 2 moving averages moving forward. If the moving average with a larger period (Senkou Span B) is below the moving average with a smaller period (Senkou Span A), the Cloud is projected to be bullish. The colors tend to be bright. If Senkou Span B is above Senkou Span A, then the Cloud is projected to be bearish. The color tends to be dark.
A bullish cloud means traders dominate the market, while bearish means sellers are in control. You can see the color of the Cloud changes from time to time, reflecting a change in strength from bulls to bears, and vice versa.
Cloud width also matters. The wider the cloud, the stronger the trader. To understand the current balance of forces in the market, look at this part of the Cloud, for example to the right of the current price.
Past
There is a Chinkou Span line, a line that is not included in the moving average, but a simple chart that moves with several time periods in advance, so that it appears “lagging” behind the market. The mechanism of the interaction of these lines with the price chart can give you a clue.
How to use Ichimoku on the trading platform
Those of you who are used to using MetaTrader can find Ichimoku by clicking “Insert”, then selecting “Indicators”, then going to “Custom”, then you will find “Ichimoku”. In the settings section, you can select values for Tenkan, Kijun, and Senkou Span B. You can also adjust the color of the indicator lines according to your preference.
The basic settings 9-26-52 are the original parameters created by the developer of this indicator. You can use it in any timeframe. You are also free to change the basic settings. Try to always choose an increasing value, so that the number from Tenkan becomes the smallest number and the number from Senkou Span B becomes the largest number.
Trading using Ichimoku
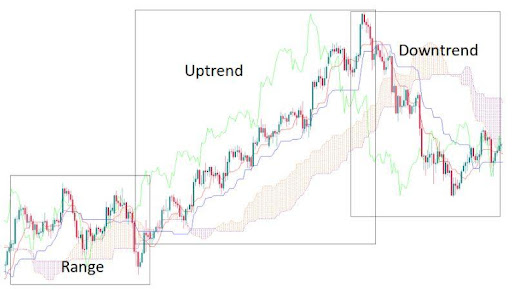
Pay attention to the picture. Ichimoku position can give you a clear view of a trend. If the market is sideways, the indicator lines turn horizontal where the price fluctuates between them. Clouds are thin and change color frequently.
The uptrend is indicated by the price above the Cloud, Tenkan, Kijun, and a thick bullish Cloud. Chinkou Span will be above the price.
The downtrend is indicated by the price below the Cloud, Tenkan, Kijun, and bearish thick Cloud. Chinkou Span will be below the price.
Ichimoku generates trading signals by crossing one price with another. Notice when a new trend starts, signals from different components tend to appear at the same time and point to a single point.
Now you know how the Ichimoku indicator works. You can try it in your trading session. By starting to use it, you have taken the first step towards learning more about this very interesting indicator.
Regularly monitor the signal so you don’t miss a good opportunity. Also keep abreast of notifications and trading signals that are often sent by Finex, so you can immediately get ready to seize vario
