To sign up for our daily email newsletter, CLICK HERE
How often have we spent quality time diving into the root cause of a problem in our project? When analyzing the reasons behind a failure, error, or issue, we expect to spend time, effort, and resources. And when we’re confident in our conclusion after a thorough investigation, it is highly rewarding. Have you experienced this?
This article discusses some root cause analysis (RCA) tools that we used in our QA project. Our QA project team members included a manual testing team and an automation testing team who worked towards improving the quality of the product being tested.
Our concern was that there was a sudden surge of defects opened by the QA team. We wanted to know why the sudden surge was occurring. Our first guess was that the quality of the product was diminishing. However, to our surprise, this was not the case.
As you read through this article, you will understand how we first assumed the main reason behind the problems we were facing. After adopting the RCA techniques, however, additional reasons not previously considered came to light. We had a breakthrough!
Find out more about how we arrived at these new conclusions:
Problems We Faced in the QA Project
In the QA project, the manual testers performed manual testing and opened defects whenever they saw issues with the product.
The automation developers developed and maintained the automation tests which the automation testers ran. When the tool reported errors, the automation testers would open defects.
Overall, the product under test was performing well in terms of the product features it delivered – the customers loved it. But, there was a problem that suddenly started creeping in. We noticed a sudden surge in the number of defects reported by the QA team. We couldn’t understand why this was happening.
We first looked into the current defect workflow. We noticed a very high count of defects were being opened by our internal test team every time a new feature was introduced. We feared this meant a lack of quality in the product. We asked ourselves: Was the product quality deteriorating? Well, that’s a fair first question to ask!
The Mind Shift We Made – Brainstorming to Find Root Causes of Issues
Of course, we were very sure that we knew the reason for the problem. But we still decided to perform a root cause analysis of the reasons for defects being opened. We first approached the defect list by release and looked for patterns.
We made use of some popular root cause analysis tools to get started. As you read through the article, you will understand how we undertook a systematic process to find the problem behind the sudden spike of defects.
RCA helps determine the defect and the main reasons for the occurrence of that defect. Eventually, after finding the root cause, the goal is to find a reliable solution so that the occurrence of the event can be reduced or eliminated.
The best part of this analysis was the revelation that what we thought was the real reason behind the issue was not the issue at all. As mentioned above, we initially believed that because of the decline in the product quality, there was a sudden spike in defects. But this wasn’t the reason. Instead, we concluded that the cause was:
- There were a lot of new joiners to the team who had not received adequate knowledge transfer. Hence, they were opening a lot of invalid defects while performing manual testing. These invalid defects might have been avoided with automation testing. But transitioning from manual testing to automation testing is a metamorphic process and thus it requires an effective automation testing tutorial in place for the new joiners.
- The test automation tool that was used was reporting errors that were not valid defects. While new features were being introduced and while UI updates occurred, the test automation developers did not update the test automation code. Therefore, the tool threw errors when it noticed a mismatch. Again, these turned out to be “invalid errors.” They were not functional defects as they appeared to be.
So, yes, though it appeared that there were a high number of defects being opened, they were mostly invalid defects. It was, of course, a great relief to know that the quality of the product was not low. However, at the same time, we realized we were wasting a lot of time in opening and analyzing invalid defects, which we then went on to resolve.
Advantages of RCA Tools
Before we discuss what tools our team used, let us reflect on RCA tools’ apparent advantages. There are several advantages to using RCA tools. Some of them being:
- Avoids prejudices and assumptions.
Sometimes we assume that the root cause of the issue is a particular factor. However, using a systematic process using the RCA tools will help you dive into facts and figures and help you derive the main reason behind the issue.
2. Encourages a systematic thinking process.
When we follow the RCA tools and techniques, we think systematically. This helps in analyzing strategies and can help you brainstorm new viewpoints.
3. Several paid and free tools/templates available on the internet can be used to perform RCA.
For example, SmartSheet, AnalysisTabs, etc., are some of the free RCA templates available. Did you know that even Microsoft Excel can be used to create charts? I personally created the Pareto and Scatter charts in this article using Excel.
Tool Examples with Real-life Scenarios
The Pareto chart is a bar chart that indicates the defect frequency. It also depicts the cumulative impact. Projects can use this chart to prioritize and plan for overall project improvements.
Have you heard about the Pareto 80-20 rule? Well, it states that 80% of defects arise from 20% of root causes. Isn’t that interesting? Or vice versa; only 20% of the performed activities are responsible for 80% of the issues that arise.
First, we grouped the defects by components. Then, using Microsoft Excel, we drew up the Pareto chart, which is built based on the cumulative and percentage data. See below:
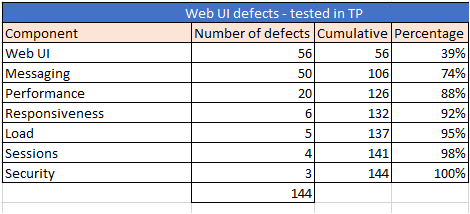
In Microsoft Excel, we saw that the Pareto chart appeared as follows:
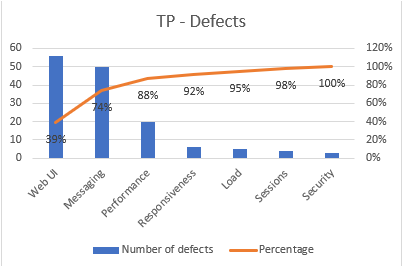
We realized that 80% of the defects arose from the WebUI component and Messaging component. Thus we figured out which factors are more significant to the root cause analysis that we were performing.
Note: In case you are wondering how to create this Pareto chart in Excel, it can be found in the Insert>Charts section. Before you draw the map, you will need to calculate the cumulative and percentage data columns, with this data used to build the Pareto chart. For detailed steps, you may follow this video.
Now we understand that the WebUI and Messaging component had the most defects reported. This was the time to brainstorm ideas on why so many WebUI and Messaging defects were occurring.
It was now clear that, unlike our earlier guess, the reason behind too many defects being opened was not the inferior quality of the product. It had to be something else.
We approached the problem using the Fishbone or the Ishikawa diagram. This tool visualizes all the causes of such defects to find the set of root causes. And in this process, the reasons are grouped as separate entities. And thus, a structure is drawn up that displays these groups. For each of the entities depicted below, we could now ask questions.

As per the entity of Testers, we realized that there was a large number of new joiners who had less knowledge of the product. We also asked why the knowledge transfer was not performed from the earlier team members to the new joiners.
Additionally, we figured out that the test automation tool we were using didn’t have the self-healing AI technology that would have otherwise helped. As new features were being introduced in the WebUI component, several UI updates were happening concerning Widget IDs. When the test automation tool ran, it failed to identify these objects and failed. If we had a self-healing AI tool, it would have fixed the code itself when it noticed the UI update and not failed for an “invalid reason.”
Next, we decided to interrogate why there were defects on the platform, directly or indirectly, because of the new joiners. We planned to approach the situation using the 5 Whys method. This is an iterative and interrogative way to find the root cause relationships of the problem being faced.
We asked ourselves a chain of questions:
- Question 1 – Why are there so many defects in the Web UI component?
- Answer 1 – Most of the defects are invalid defects, creating a high count overall
- Question 2 – Why are there too many invalid defects?
- Answer 2 – The component has mostly new joiners on the team who have less knowledge of the element.
- Question 3 – Why do they have less knowledge about the component?
- Answer 3 – They are new joiners
- Question 4 – Why are there only new joiners?
- Answer 4 – It is a new component. The experienced members have moved on to another element.
- Question 5 – Why is it that the new joiners lack knowledge on the new component?
- Answer 5 – The new joiners did not receive the requisite knowledge transfer on the component from the experienced members.
After we reached the 5th answer in the series, we concluded that we needed to implement a high-quality knowledge transfer plan for the new joiners from the experienced members.
Next, we wanted to be sure about what we were deciding. We wanted to see in facts and figures a convincing correlation between the number of defects and the number of new joiners. Turned out it was a positive correlation. Let us explore this further.
We created a scatter diagram through Microsoft Excel. This chart is used for analyzing relationships between two variables to understand how closely the two variables are related. In this process, one variable is plotted on the x-axis and the other on the y-axis.
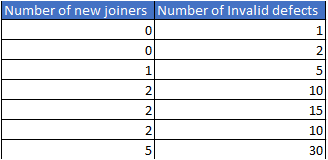
We collected this data as follows:
Accordingly, we immediately noticed the correlation when we used Microsoft Excel to draw the Scatter plot diagram.
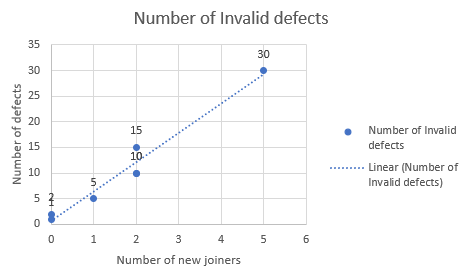
With this, we concluded it was a positive correlation: the two entities, namely the number of new joiners and the number of defects, were positively correlated.
Note: If you are wondering how you can build a scatter plot in Microsoft Excel, you can find this in the Insert>Charts section. For detailed steps, you can follow this video.
Our Quick Action Plan
We solved these issues in straightforward ways, and the project immediately saw a vast improvement. The solutions that we arrived at were:
- Manual testing – The new joiners’ manual testers were provided with knowledge transfer and an expert buddy to guide them on the component.
- Automation testing – We found a test automation tool that has inbuilt self-healing AI technology. Tools that have this feature fix the automation code itself when it notices a product UI update. That way, if a feature update caused a UI attribute value to be updated, the tool itself would correct the code, and continue testing instead of “incorrectly” failing.
In the end, we had a reliable QA team that opened high-quality valid defects, and we shared this invaluable experience with other teams in the organization too.
Conclusion
This logical way of solving the problem helped our QA project in many ways. Over time, we were able to ramp up the tester’s knowledge. The move to using an advanced automation test tool helped immensely, and we noticed a decrease in invalid defects being opened.
As a result, the product developers also experienced the impact of this move. They were spending their time solving valid defects rather than analyzing invalid weaknesses that eventually were rejected.
Through this process, we came to understand that approaching the problem logically helped the organization. As a result, customers were happy too. We realized that rather than solving the problem with a bandage, it would ultimately be more useful to approach the problem systematically. After all, we have a plethora of RCA tools available. The result was a more permanent solution to the question. Because, this way, we are sure of the facts and figures behind the failures.
