To sign up for our daily email newsletter, CLICK HERE
Today, cryptocurrency trading is gaining immense popularity as this type of investment can bring good profits. Since cryptocurrency is very volatile, traders should be ready for very frequent trend changes in the market. Therefore, it is necessary to study it before starting the trading process and investing their funds in cryptos.
Candlestick charts are one of the best ways to analyze the market and price functions as well as find out what strategy to use in crypto trading. Let’s take a closer look at how to read a candlestick chart.
What are candlestick charts?
A Japanese candlestick is an advanced tool that is intended to forecast price movement. Due to this type of chart, traders can analyze the cost of the digital asset for a given amount of time. This chart comprises candlesticks that show the same timeframe. The extent of this period can take up to a few seconds to the number of years.
Traders can use candles to analyze various types of data, but they mostly use them to learn about price fluctuations in the financial markets. If traders use candlestick charts correctly, they will be able to assess the likelihood of a change in the value of an asset and choose the right strategy in crypto trading.
Japanese candlestick structure

Each candlestick consists of the following elements that reflect the change in the value of an asset over a certain period of time:
- Open is the first traded price of an asset for a given period.
- High is the highest traded price for a given period.
- Low is the lowest traded price for a given period.
- Close is the last traded price for a given period.
These meanings are also known as OHLC (Open-high-low-close chart). The proportion between open, high, low, and close establishes the kind of candlestick.
The spacing between the open and close is named the body.
The distance between the body and the high/low is referred to as the wick or shadow.
The distance between the high and low of a candle is called the candle’s range.
How to read the Japanese candles?
Japanese candlesticks provide similar data as line charts or regular bars. Nevertheless, they are more widely used as they give detailed and clear information about the cost of digital asset functions in the market.
Candlesticks reveal the buyers’ and sellers’ impedance within a certain period. As a rule, the longer the body, the greater the buying or selling pressure was. Short wicks demonstrate the high (or low) cost of the asset during a defined period that has been near the closing.
Also, it is necessary to pay attention to the color of candles.
First of all, each candle has one of two colors: red and green, or, in a different color scheme, black and white. You’d better remember the meaning of both Japanese candlestick combinations, as both are quite common.
A green candlestick indicates that the price has been increasing in a given period of time, while a red candlestick gives a signal that the price has been falling. Accordingly, if you look at the chart and see that there are significantly more green candles than red ones lately, and they are clearly longer, then it may well be that you are in front of an uptrend. But a large number of red candles with a high degree of probability will be exactly on the downtrend chart.
If you have a black and white version in front of you, then white candles help you quickly determine that quotes are going up, and black candles show that the price is going down.
Major Japanese candlestick patterns
The patterns are divided into two groups according to the nature of the signals. These are candlestick reversal patterns and trend continuation patterns.
– Japanese candlestick reversal patterns (Harami, Harami Cross, Bearish and Bullish Engulfing, Hanging Man, Hammer, Inverted Hammer, Shooting Star, Dark cloud cover, Piercing Pattern, Morning Star and Evening Star, Morning Doji Star and Evening Doji Star, Upside-gap two crows, Three Black Crows, Bearish and Bullish belt hold, etc.).
– Patterns of Japanese candlestick trend continuation (Mot-hold pattern, Separating Lines, Push, Thrusting fine, Three white soldiers, Rising three methods, Three Falling Methods, Gapping side-by-side white lines, and others).
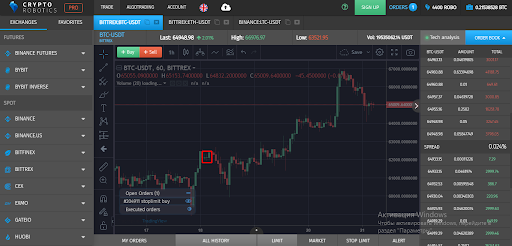
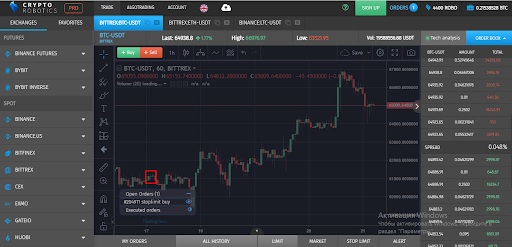
Each candlestick pattern has a certain meaning that shows the sentiment of market participants and price movements. Let’s look at a few of these patterns via the Cryptorobotics terminal.
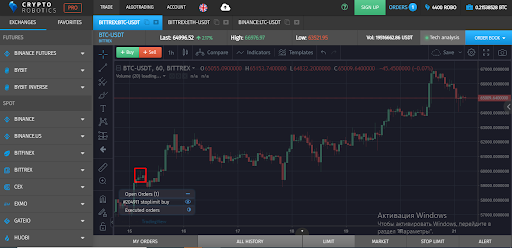
How to use Japanese candlesticks in the Cryptorobotics trading terminal?
Bullish reversal patterns
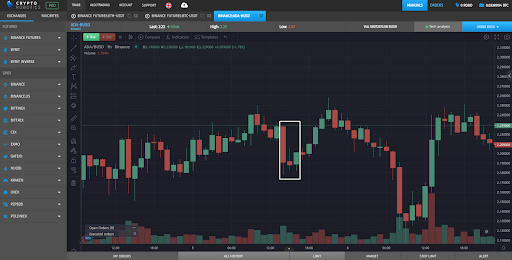
Hammer

A hammer is a candle that has a long lower wick and a small body at the top of the candlestick. Hammers indicate bearish trends and suggest that the cost of digital assets may go up soon.
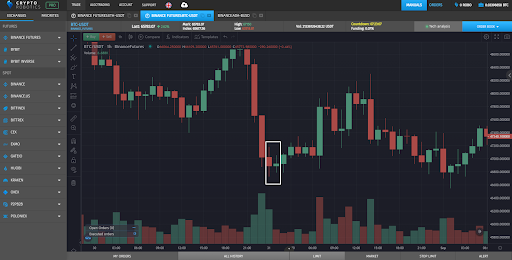
Inverted Hammer
The inverted hammer is the type of candlestick with a long upper wick and a small body at the bottom of the candle. Like the hammer, an inverted hammer occurs when bearish trends come. This implies a price reversal.
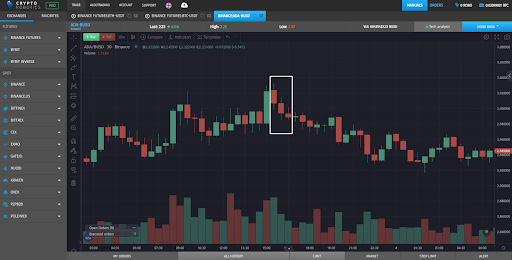
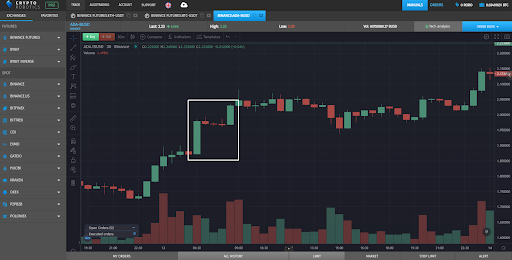
Three white soldiers

The three white soldiers are three consistent green candles that open within the body of the prior candlestick and close at a more senior level than the last one.
This pattern specifies that sustained pressure of buying causes the rise in price. Ideally, such candlesticks shall not bear long lower wicks. The candle’s size and the wick length can be applied to estimate the probability of a consolidation or a possible drawdown.
Bullish Harami
A bullish harami is a lengthy red candle abiding by a lesser green candle that is inside the body of the prior one.
Bullish harami can go on for more than two days. This pattern demonstrates that the sales momentum is going slow and may come to a close.
Bearish reversal patterns
Hanging man

The hanging man looks exactly like the hammer, but it occurs when bullish trends come and means that a downtrend may dominate in the market soon.
Shooting star

The shooting star is a type of candle with the same structure as the inverted hammer. When it arrives during a bullish market, it shows that the price growth could stop and the trend will change.
Three black crows
The three black crows pattern comprises three consistent red candlesticks that open within the former candlestick’s body and close beneath the low of the prior candle.
This is the same pattern as the bearish three white soldiers. It should be noted that these candlesticks don’t have to be with long and high wicks to demonstrate continuous pressure of selling pulling the price down. The candles’ size and the wicks’ length can be utilized to assess the probability of consolidation.
Bearish harami

A bearish harami is a long green candle and a short red candle with a body that is entirely inside of the body of the former one.
Bearish harami can change for more than two days. They emerge around the end of an uptrend and can give a signal about reducing buying.
Dark cloud cover
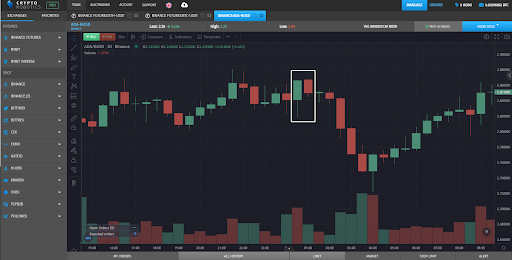
A dark cloud cover is a candle indicating the change of an uptrend and falling the cost of assets. This pattern is composed of long red and green candlesticks, the wicks of which are usually small.
The second red candle is located over the prior green one and indicates a bearish sentiment in the crypto market. However, this does not mean that if you recognize it on the chart, you should sell your crypto at once.
Like most things, you need to wait until the trend is confirmed. If the downtrend is confirmed, you should sell the coin.
Continuation patterns
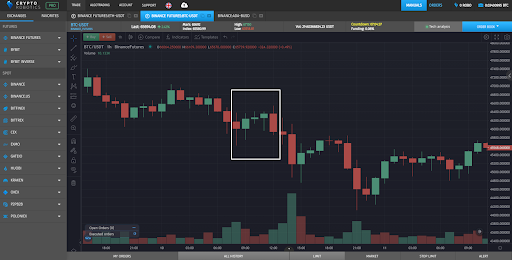
Rising three methods
Rising three methods is a pattern that occurs in an uptrend, where three consistent red candlesticks with short bodies prove the ongoing current trend. It is worth noting that red candles should not go outside the range of the former candle.
The continuation is proved by a green candle and a large body that demonstrate the bulls control the direction of the market trend once more.
Three Falling Methods
The three falling methods mean a prolongation of the bearish trend.
Doji Japanese candle
Doji appears when the simultaneous coincidence of the candle’s opening and closing occurs if they are very near each other. The fluctuations in the price can be up and down, but either way, it will close at the level or alongside the open. Therefore, the Doji pattern points out the traders’ hesitance between buying and selling.
Nevertheless, the meaning of such candlesticks depends more on context.
According to whether where the match is, the Doji can be divided into the following types:
- Gravestone Doji shows that a bear market is coming soon.
- Long-legged Doji gives a signal about traders’ indecision in the crypto market.
- Dragonfly Doji can show the possible emergence of both bulls and bears markets depending on context.
According to the initial meaning of Doji, the opening and closing of the candle should be exactly the same. But if they are not similar but are simply located near each other, such a pattern is referred to as a spinning top. However, owing to the cryptos’ high volatility, accurate Doji is rarely seen. Thus, the spinning top is usually utilized as a synonym with Doji.
It is worthwhile to mention these are not all patterns, but only the main ones that are most often found on charts.
Conclusion
Candlestick patterns are considered one of the best tech analyses and traders should use them before starting the trading process. Candlestick patterns are considered one of the best technical analyzes due to the fact that they provide information about price movement and predict possible changes in the current trend. Thus, traders can choose the right cryptocurrency trading strategy, increase the chances of making a profit from the trade, and prevent loss of funds with the help of Japanese candlestick analysis.
